Add devices
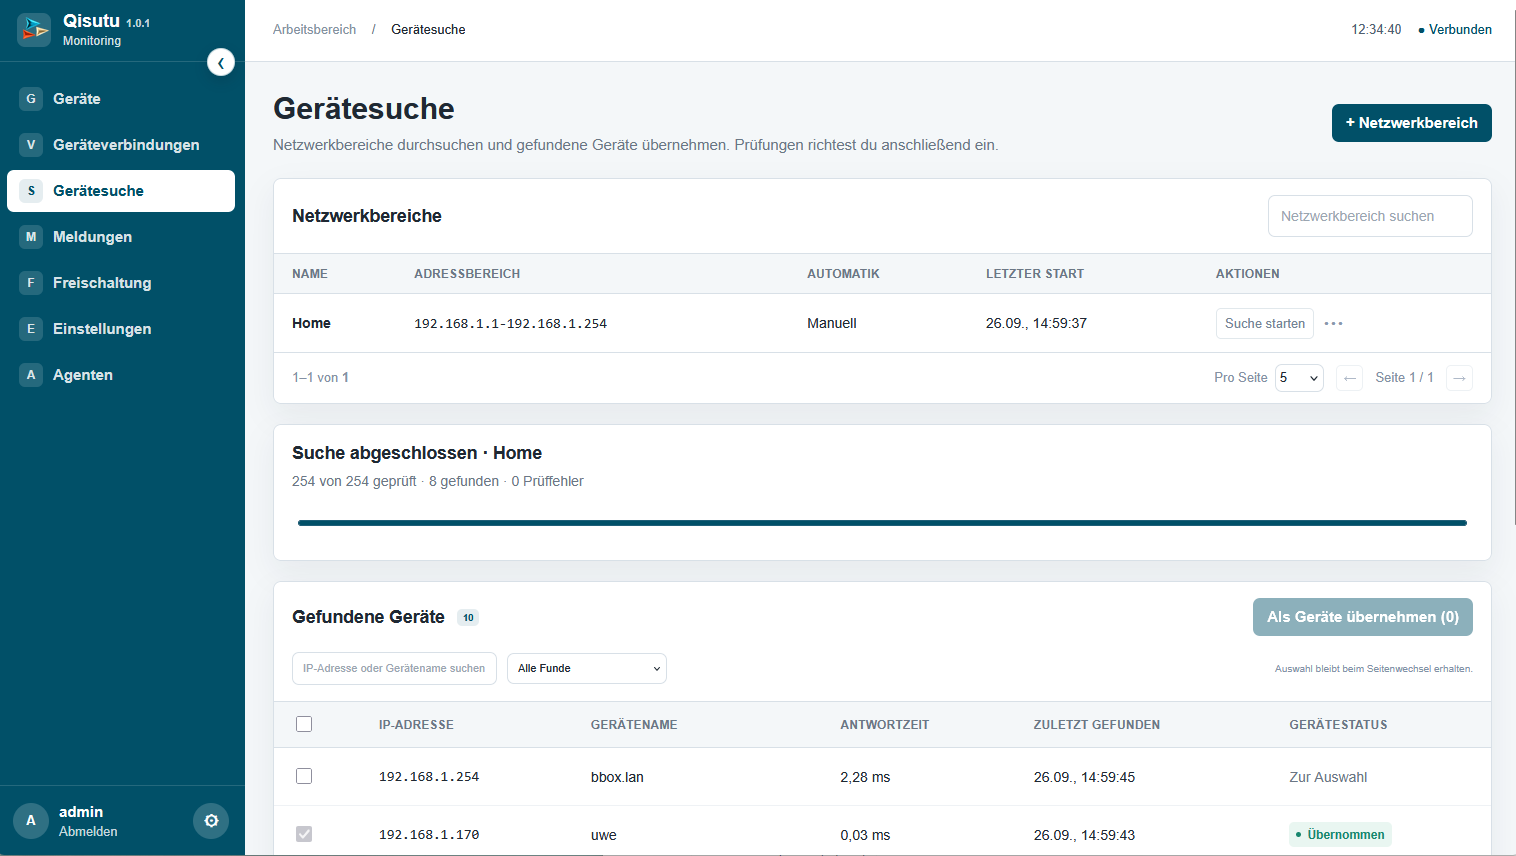
Add devices directly or discover them on your own network and organise them into groups.
Open source. On your own server.
Qisutu Monitoring monitors Linux and Windows servers, network devices, databases and printers. Track resource usage, network quality and service availability, review metric history and receive notifications when problems occur. The software runs on your own server.
Explore features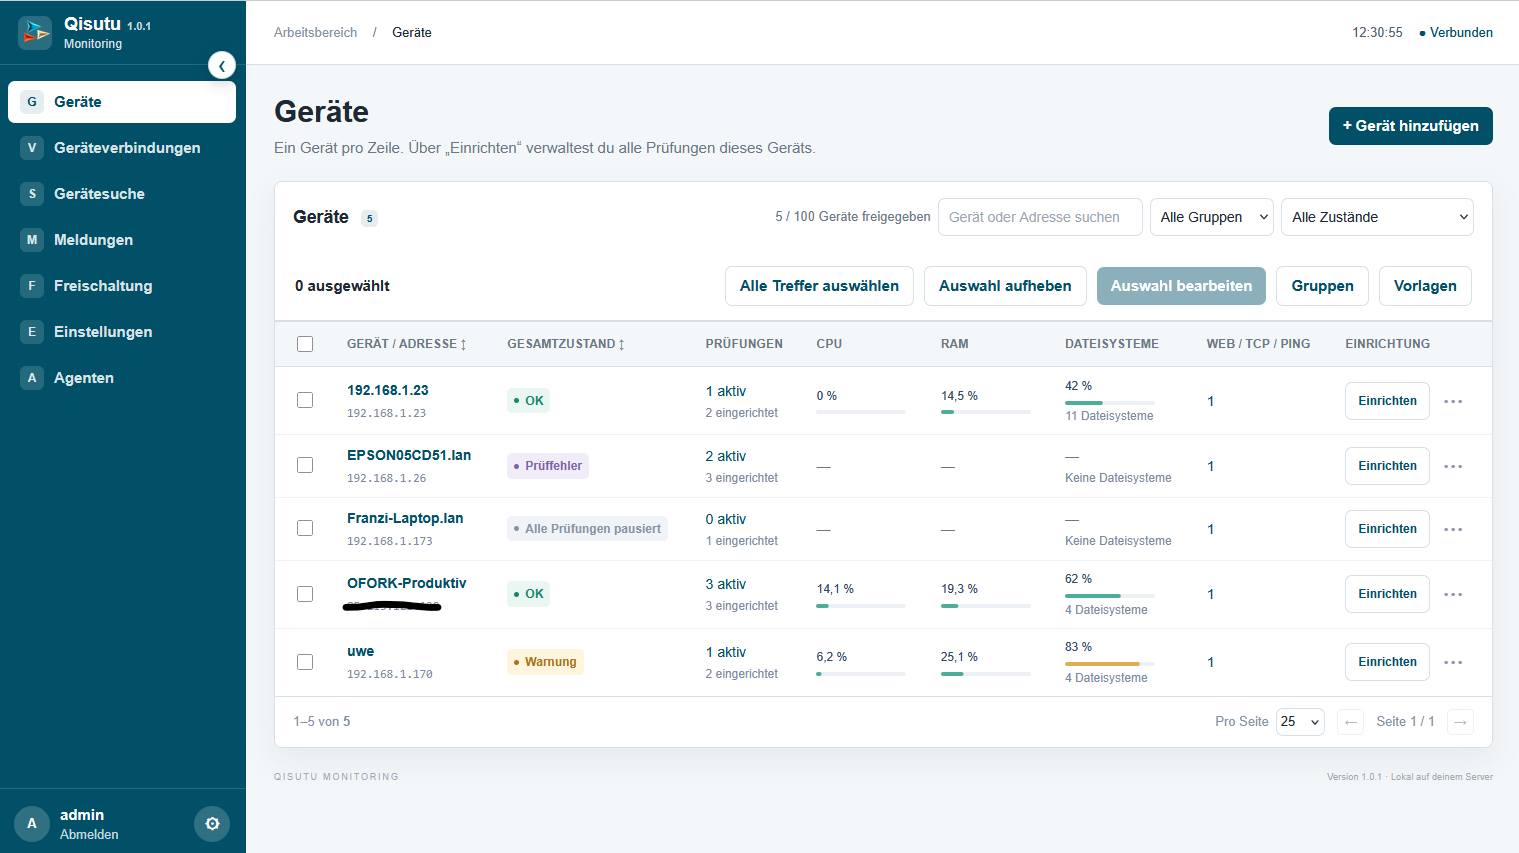
From server resources to printer toner, Qisutu Monitoring brings technical measurements and clear statuses together. See which check needs attention and follow how its values change over time.
Servers & resources
Track CPU, memory and file systems on your Linux and Windows systems. Additional checks cover processes, services and disk performance, helping you spot dwindling resources or a required service that is no longer running.
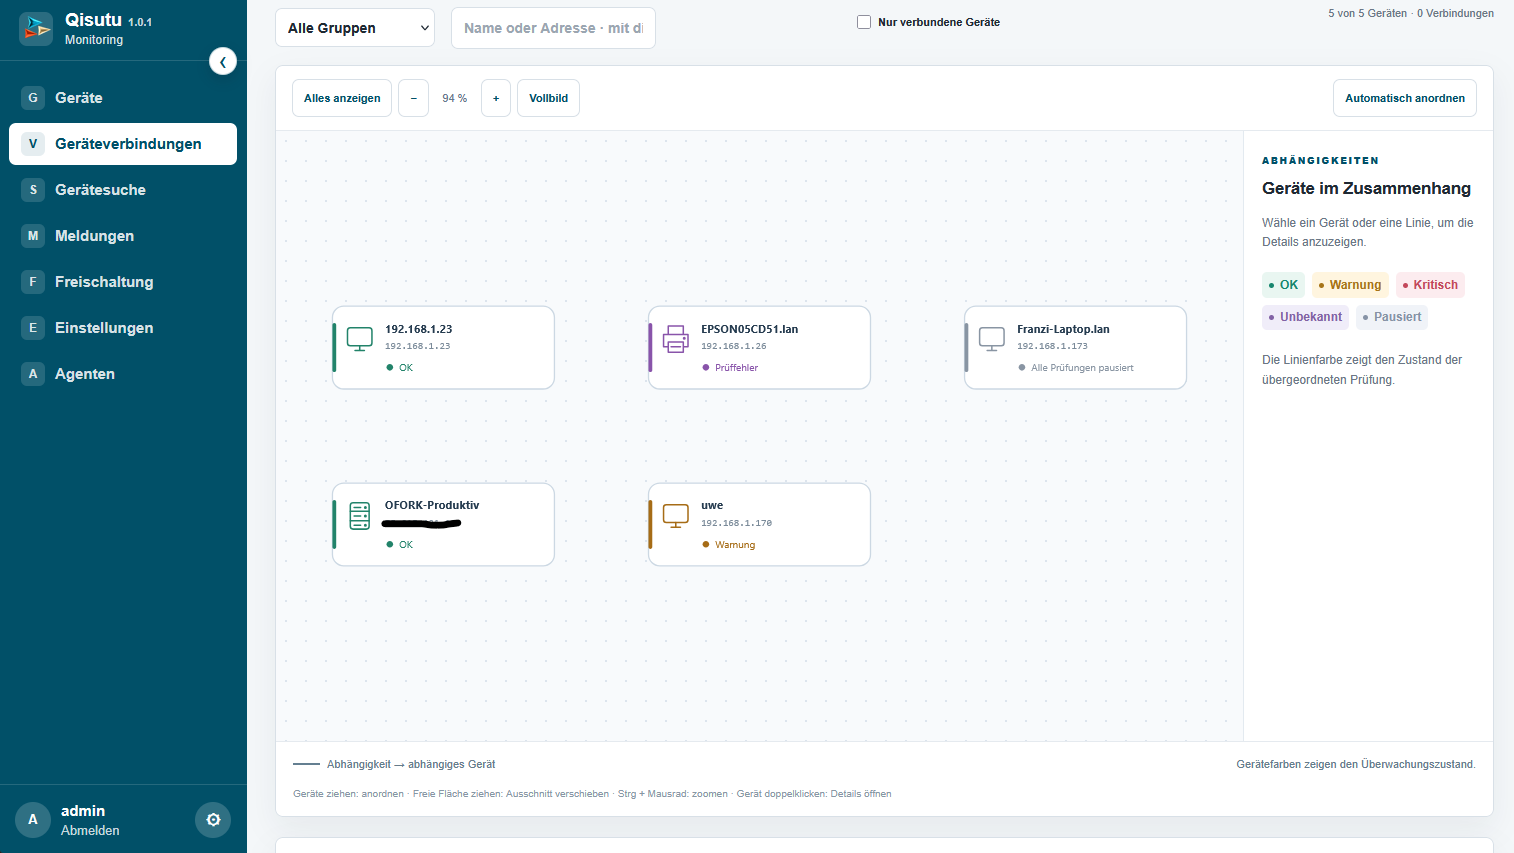
Networks & traffic
Monitor traffic, utilisation and errors on network interfaces and switch ports. Packet loss, response times and their variation reveal connection quality. NetFlow and IPFIX associate exported traffic with its sources and destinations.
Databases & services
Check MariaDB/MySQL and PostgreSQL using login and real read queries. Connections, active queries and cache statistics provide context. HTTP/HTTPS, TCP, DNS and TLS certificate checks extend service monitoring.
Printers & hardware
Identify printer problems and track supplies and counters over SNMP. Hardware checks extend monitoring to servers, Synology NAS and UPS systems, including temperatures, drives or power supplies where the device provides these values.
Problems & recoveries
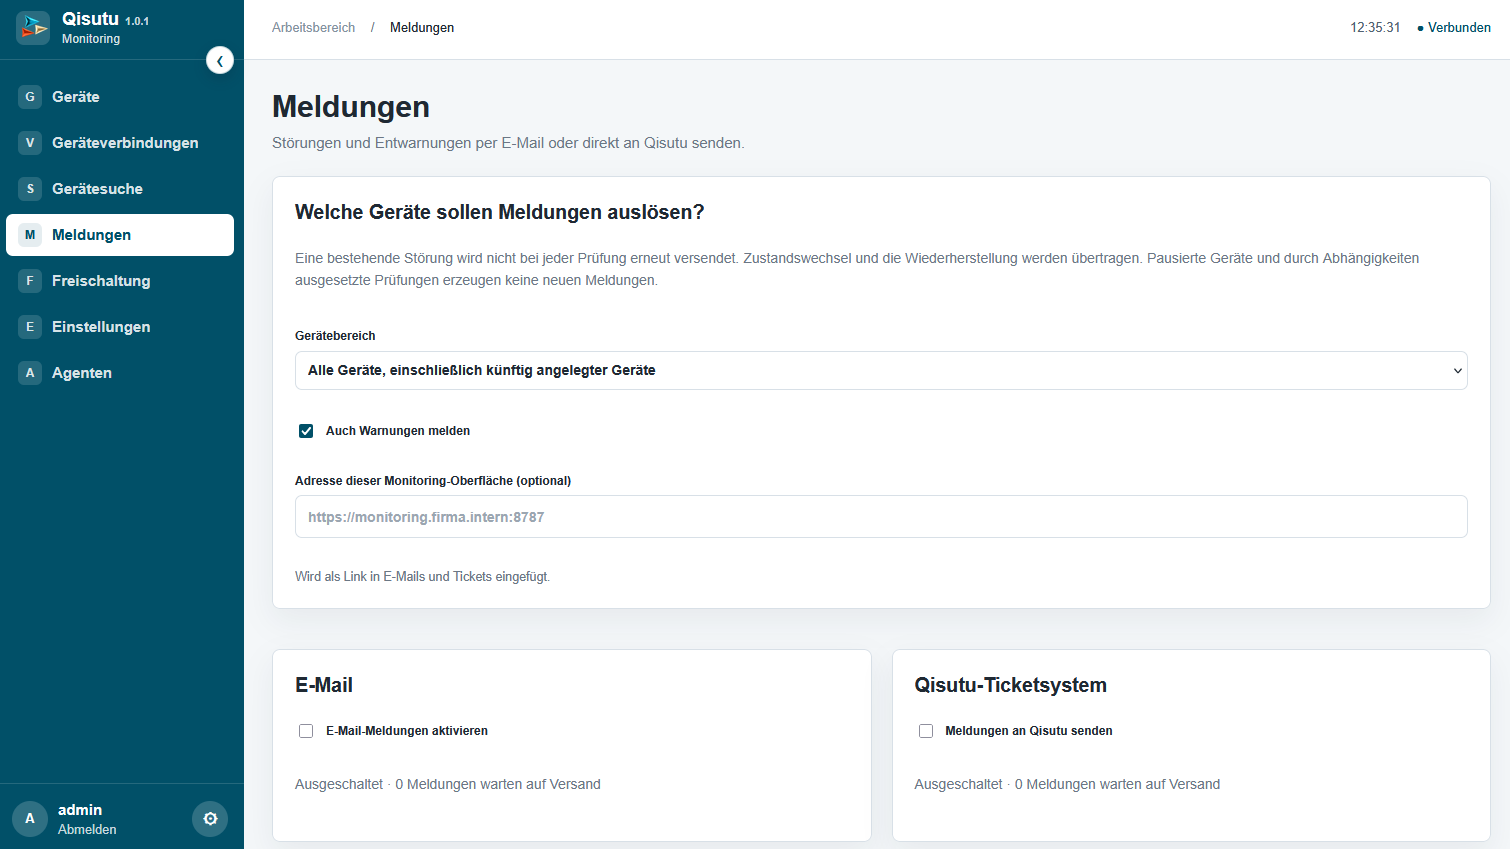
Receive problem and recovery notifications by email or send them to the matching monitoring add-on in the Qisutu ticket system. Limit notifications to selected groups and devices. An unchanged problem is not reported again on every check.
Add devices directly or discover them on your own network and organise them into groups.
Choose a template, configure access and check which metrics are available.
Review status and history, and receive notifications about problems and recoveries.
Multiple agent accounts with equal permissions work together. Each account keeps its chosen language after the next login.
Receive problem and recovery notifications by email or send them to the compatible monitoring add-on in the Qisutu ticket system.